
What has Changed from FY25 to FY26:
Year on Year Reduction one again!
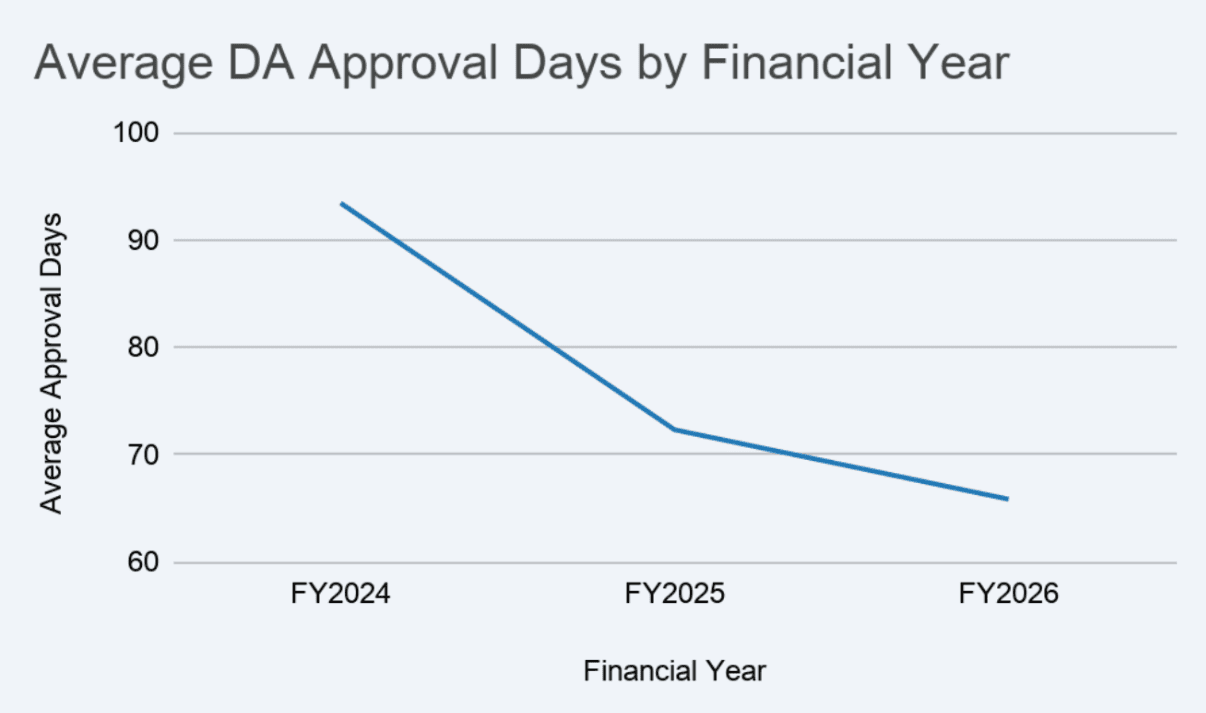
- In FY24, 25 and 26, Fernleigh’s DA turn around has decreased, taking weeks off at a time.
- Between FY2024 and FY2026, the average approval time decreased by 27.58 days (an approximate 29.5% reduction in that time).
- FY2025 to FY2026 (an additional drop of 6.47 days) – I.e. Cutting another week off of the timing for applications.
Biggest Individual Decreases (YOY)! – Top 5:
- Dungog Shire – 78% Decrease
- Lithgow City – 63% Decrease
- Armidale Regional – 61% Decrease
- Bega Valley – 56% Decrease
- Wingecarribee Shire – 54% Decrease
Average DA Fee in FY26: $733.32
What may have caused this?
- Improved process: Fernleigh’s continual improvement of our council services process, drafting and documentation quality, precedent recordings and use of the PlanDAT system has allowed us to continually reduce our turn arounds in spite of ongoing council resource shortages.
- The PlanDAT Effect: Applications that have been educated on the council guidelines with a PlanDAT report before getting their design arranged by a shed supplier see better results and shorter turnarounds on Development Applications. Variations to Council Guidelines = Extra Time in the hands of council. Our article on “Staying in the Lines” delves into this further.
- Nimble response: Changes to the planning process across NSW has seen changes to the pre-assessment and post consent condition portions of the applications. Due to the high volume we complete and the experience we have, Fernleigh have been able to maintain an adaptable response to the changes in the approvals process and a team capable of arranging documentation to respond to changing council requirements. Alongside this, new planning minister expectations (often referred to as ‘ministerial expectations’) have put further pressure on council to determine council applications in quicker time frames.
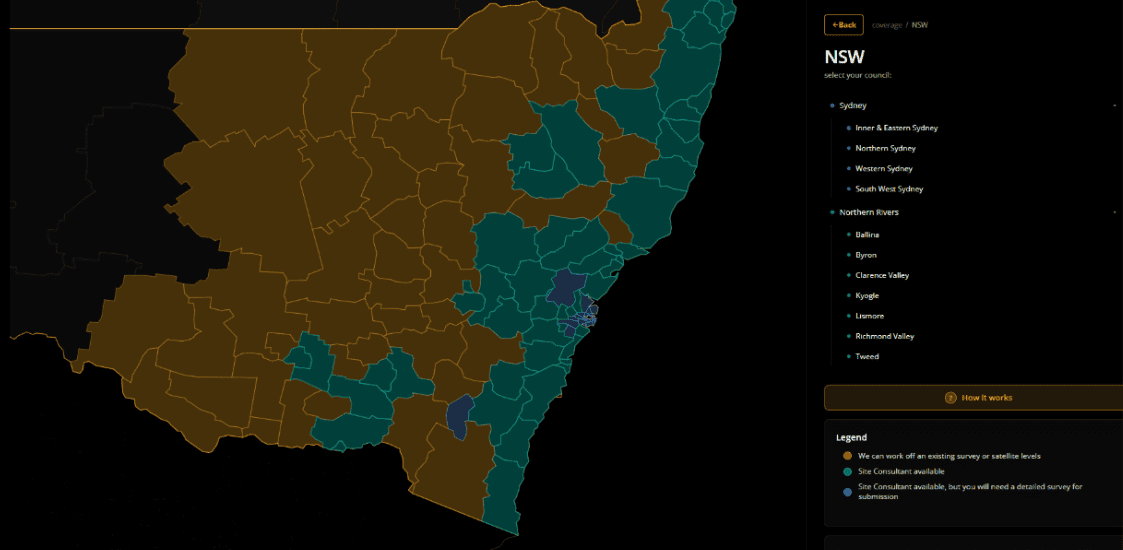
- Increased Coverage: Fernleigh has been able to increase the volume of applications lodged in regional hubs across NSW and have continued to set up new local consultants in these areas. Our website now shows our increasing coverage across both NSW and the rest of Australia!
5. Reduced numbers of housing applications: Reductions in new housing applications have led to increased resources in council being allocated towards shed applications and ancillary developments across NSW.
What does this mean for approvals in EOFY27:
Council timeframes continue to trend down, and with more data available to Fernleigh and our staff we are able to provide more clarity to customers on the grey area of council approvals i.e;
- How long the approvals take,
- How much the costs – including council fees data,
- And other potential intricacies or nuisances per council.
Over the coming weeks and months Fernleigh will be posting council-by-council articles to give more insights on the last 12 months in YOUR council! Including location specific issues being faced, additional changes affecting your local council!